


Wondering what the purpose of the Business Summary Variance report in Kitomba 1 is and how best to use it?
The Business Summary Variance report in Kitomba 1 is your secret weapon for understanding trends in your business performance—it enables you to compare date ranges for the most important metrics in your business in one handy report, making it easy to identify trends and see what you need to work on.
Sounds amazing, right? It is! Here are our top three reasons to use the Business Summary Variance report in Kitomba 1 to make sure you’re getting the most from your Kitomba software.
1. Make more informed decisions for your business
The number one reason why reporting is important, and why the team at Kitomba works so hard to deliver you the best, the most accurate and detailed reporting in the industry, is because this gives you the information you need to make more informed, data-driven decisions for your business.
Why does that matter? Without knowing your numbers and having accurate information available, you don’t really know how your business is performing. This makes decision-making somewhat random and intuition-based, which can be risky.
Since numbers don’t lie, making data-driven decisions is a surefire way to drive business success.
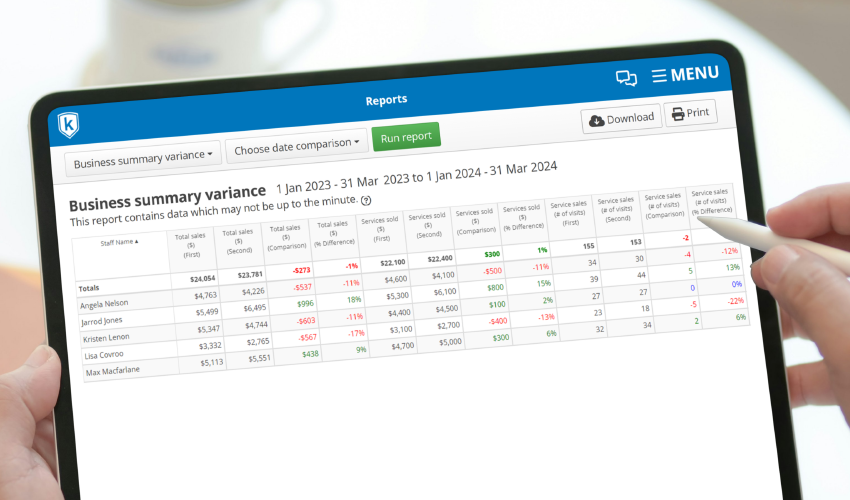
Just like Kitomba’s famous Business Summary report (but even better), the Business Summary Variance report makes it simple to make comparisons and see percentage changes for the numbers (KPIs) that are most important to your business, such as rebooking rate, average client spend, service sales, appointment retail sales and more.
This makes it easy to understand how your business is tracking compared to the past, helping you to make data-driven, realistic decisions when setting your business goals and targets.
With accurate and up-to-date information, you can reduce the margin for error and be confident in the data displayed allowing you to set the right kind of KPIs for your business and set realistic goals based on past performance.
To learn more about the Business Summary report visit our website: Kitomba Reports.

2. Evaluate performance over time and set appropriate and realistic goals
You can start by measuring the performance of your chosen metrics and see if things have improved over a selected date range.
Perhaps you’ve adjusted your product prices and want to see how that’s impacted appointment retail sales, or on a smaller scale just seeing the impact of a Mother’s Day promotion this year compared to last. Simply select your chosen KPIs, choose the date range you wish to compare and run the report to see any changes over the selected time frame. It’s that simple.
The report allows you to focus on performance in your business operations and individual staff members’ targets. It will display results for both, making it easy to assess performance and growth, and what areas need improvement.
When evaluating a specific date range the report will automatically populate the date for the comparison you select. Available comparison options are:
- Weekly – view the past week’s performance.
- Monthly – see how you’re performing month on month.
- Quarterly – check your quarterly report against the same quarter the previous year.
- Annually – track and review your individual staff and business goals.
If you’re a Kitomba Enterprise customer, you can view the report by location. Simply toggle between locations to see the different reports for each.
3. It’s automated and easy to understand
Don’t get lost in multiple reports trying to find the information you need. This automated report allows you to quickly compare date ranges with just a few clicks. It’s time-consuming when you need to download and open reports in spreadsheets to make comparisons, but the Business Summary Variance report removes the need to do that, saving you time and headaches.
The report’s consistent format ensures that data can be collected and viewed easily as it populates the information for you. You will see the original figures, comparative figures, and the percentage change (increase or decrease) which is colour-coded so you can easily see the difference. Green indicates an increase, while red indicates a decrease. This makes it easy to identify patterns or trends of growth in your business when the data is all in one place.
It’s also really smart. The Business Summary Variance report knows how to handle months with different amounts of dates to adjust so the comparisons are all relative. That way, you can rest assured that the comparisons made are accurate.
For more information about reporting in Kitomba, view our support guide.
Read next: